
Measuring Your Cleaning Productivity Baseline Before You Automate
At a glance: A robot business case is an arithmetic claim: the fleet does the work of N labour hours at a lower cost. That claim rests entirely on one number, the productivity baseline, and in most projects the baseline is an estimate borrowed from a vendor deck rather than measured on the floor. Get it wrong and the payback that justified the purchase quietly evaporates. This guide sets out how to measure the number properly, and the traps that make guessed baselines flatter than reality.
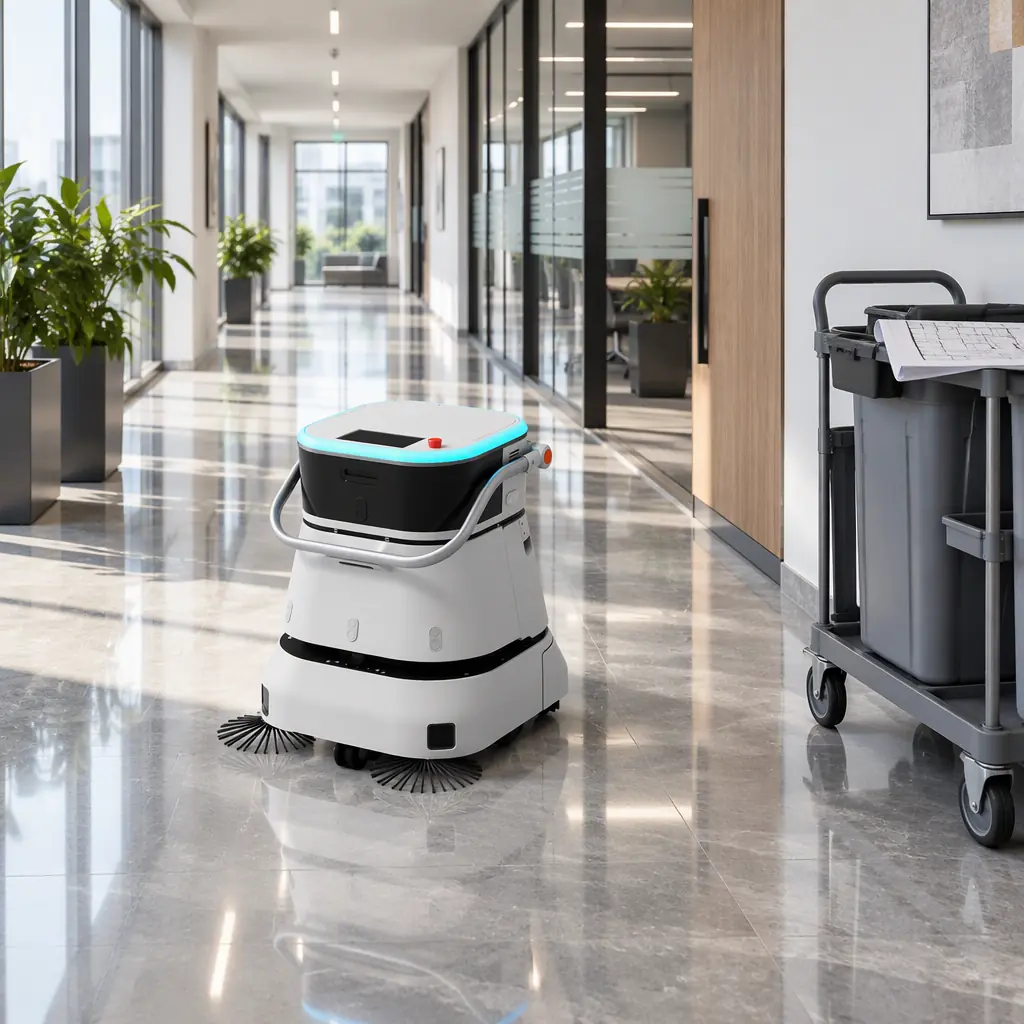
Why a Guessed Baseline Breaks the Business Case
The baseline is the denominator of the entire payback calculation. It states how many square metres of floor one cleaner-hour actually delivers today, including the walking, the setup, the re-fills and the interruptions. When that number is too high, the labour savings are overstated, the fleet is undersized, and the robot is blamed for a shortfall that was built into the spreadsheet.
The most common error is adopting a vendor's headline coverage figure as your baseline. That figure is a peak, not an average. It usually assumes an empty floor, ideal aisles, a full battery and no interruptions. Your building has people, furniture, spill responses and shift handovers, every one of which subtracts from throughput. The gap between the headline and the real number is the difference between a business case that survives and one that does not.
Measure first. The effort is a single well-run study of two to three representative shifts, and it de-risks a multi-year capital decision. The way that measured baseline then feeds the fleet arithmetic is set out in the throughput planning guide.
The Two Measurement Methods
Use one of two methods depending on how much precision the decision needs. Both convert observation into a defensible number; neither requires specialist software.
| Method | How it works | Precision | Effort | Best for |
|---|---|---|---|---|
| Area-rate sampling | Time a cleaner over a defined zone, divide area by hours | Medium | Low, one observer per shift | Quick sanity check across many zones |
| Task-time study | Break the shift into tasks, time each, sum the productive time | High | Medium, a full shift of observation | Capital decisions and contract re-bids |
Area-rate sampling is the faster start. Pick three zones: an open floor, a corridor network, and a restroom block. Time each clean from setup to finish, record the area, and compute square metres per labour-hour. You will find the three rates differ sharply, which is the first useful finding: a single site-wide rate hides the mix. Task-time study goes further by timing the components, so you can see how much of the hour is walking and how much is actual cleaning, and therefore how much a robot can realistically capture.
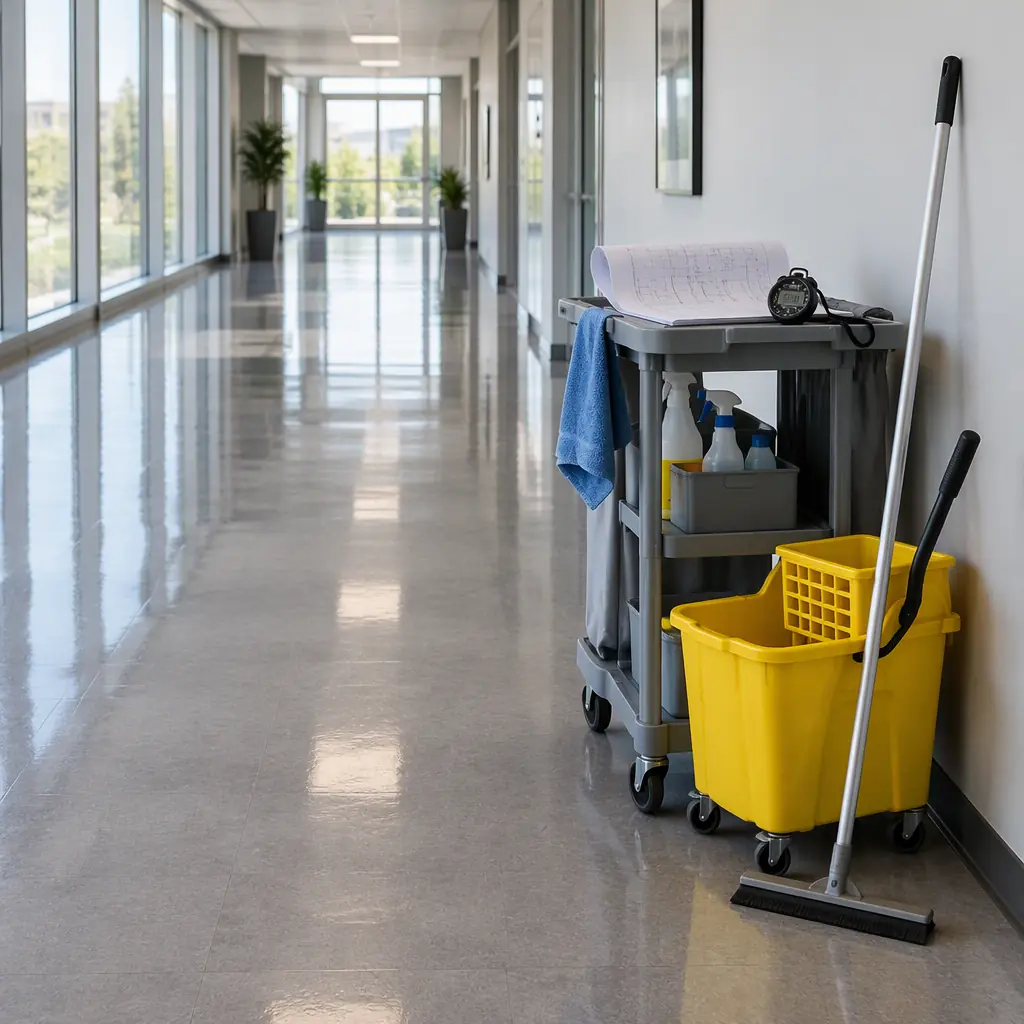
The Cleanable-Area Trap
Gross floor area is not the number you want. A large share of any building is not cleanable by a scrubber: walls, columns, behind furniture, stairs, restroom interiors, and the zones occupied by racking or desks. Counting gross area inflates the addressable floor and therefore the apparent need for robots, or inflates the perceived saving.
Walk the building and classify every square metre into three buckets before you measure anything:
- Machine-cleanable: open hard floors the robot can reach without rearrangement. This is the addressable area.
- Semi-cleanable: floors reachable only after moving furniture or cordoning, or requiring a manual pre-sweep. Real, but with a setup cost.
- Non-cleanable by machine: stairs, tight restrooms, edge detail, soft flooring, everything the robot will never touch. Deduct it entirely.
In a typical office the machine-cleanable share of gross area lands between 45% and 65%. If your business case used gross area, it is overstated by up to half before you have even started, and the correction is one walk of the building. The measurement discipline mirrors the readiness checks in the site survey method, which uses the same three-bucket classification as its first output.
What the Baseline Must Capture
A baseline that only records cleaning speed is incomplete. The value of automation lies in what it removes from the labour requirement, so the baseline must separate productive cleaning time from everything around it.
| Component | Why it matters | Robot captures it? |
|---|---|---|
| Productive cleaning time | The core work being replaced | Yes, on cleanable hard floor |
| Setup and re-fill time | Fixed overhead per shift | Partly, one dock cycle replaces several re-fills |
| Walking and repositioning | Often 20-35% of a manual shift | Largely, the robot returns to dock itself |
| Break and handover time | Legal and organisational, not eliminated | No, remains a cost |
| Interruption handling | Spills, requests, unexpected mess | Partly, robots log exceptions for human follow-up |
Walking is the component buyers overlook. In a task-time study it is common to find that a cleaner spends a third of the shift moving between zones rather than cleaning them. A robot does not walk to fetch a mop, so that third is where a large part of the saving actually comes from. Recording it explicitly is what makes the saving credible rather than assumed. The labour-cost side of that equation is worked through in the cleaning robot labour cost model.
Capturing Variance, Not Just the Average
An average hides the shifts that decide the fleet size. Measure the spread. Record the baseline across at least three shifts on different days, and note the conditions: occupancy level, weekday versus weekend, weather, and any event that pushed the workload up.
Variance is why fleets are sized on the worst realistic day rather than the mean. If your baseline is 900 m2 per labour-hour on a quiet shift but 520 on a busy one, sizing a fleet on the average will leave the floor unserved on the days that matter most. The size of that gap is the operating margin the fleet must hold, and it is invisible in a single-shift study.
Express the baseline as a range, not a point. A defensible baseline reads: "between 520 and 900 m2 per labour-hour depending on occupancy, most often near 700." That range is what lets the business case carry a sensitivity check rather than a single optimistic figure.
Turning the Baseline into a Go/No-Go
With a measured baseline and a classified cleanable area, the go/no-go becomes arithmetic instead of advocacy. Multiply the addressable area by the cleaning frequency to get weekly cleanable square metres. Divide by the measured baseline range to get weekly labour hours. Compare that against the labour hours a proposed fleet would replace, and the business case either holds across the range or it does not.
Three outcomes are possible. If the fleet clears the requirement across the whole range, proceed. If it only clears on the optimistic end, the project is a phase-one pilot, not a fleet purchase. If it fails even at the optimistic end, no robot purchase fixes it, and the honest answer is to revisit the cleaning specification. Running that third outcome honestly is worth more than a headline that flatters the decision. The wider payback logic this feeds is set out in the payback period calculation.
Frequently Asked Questions
How long does measuring a baseline take? One observer across three shifts is enough for a defensible range. The area-classification walk adds two to three hours and is arguably the highest-value part of the exercise.
Can I use the robot's own coverage data as the baseline? No. That measures the robot, not the manual work being replaced. The two rates are not interchangeable, and substituting one for the other is the most common way a business case becomes circular.
What if my current cleaning is outsourced and I have no time data? Ask the contractor for task-time records or observe directly. If neither is possible, run area-rate sampling on three zones for a week; even a rough measured baseline beats an inherited vendor estimate. Where the work is outsourced, the baseline also anchors the RaaS bid model for janitorial contractors, because the contract price and the robot economics both derive from the same measured rate.
Get a Quote
Tell us about your space and workload, we reply within 24 hours.