
At a glance: Every cleaning robot fleet emits hundreds of channels of telemetry, and almost none of it predicts a failure. This guide separates the dozen signals with real predictive value from the ones that only describe the past, gives threshold ranges for the signals that work, and sets out the arithmetic for deciding whether predictive intervention is actually cheaper than running to failure.
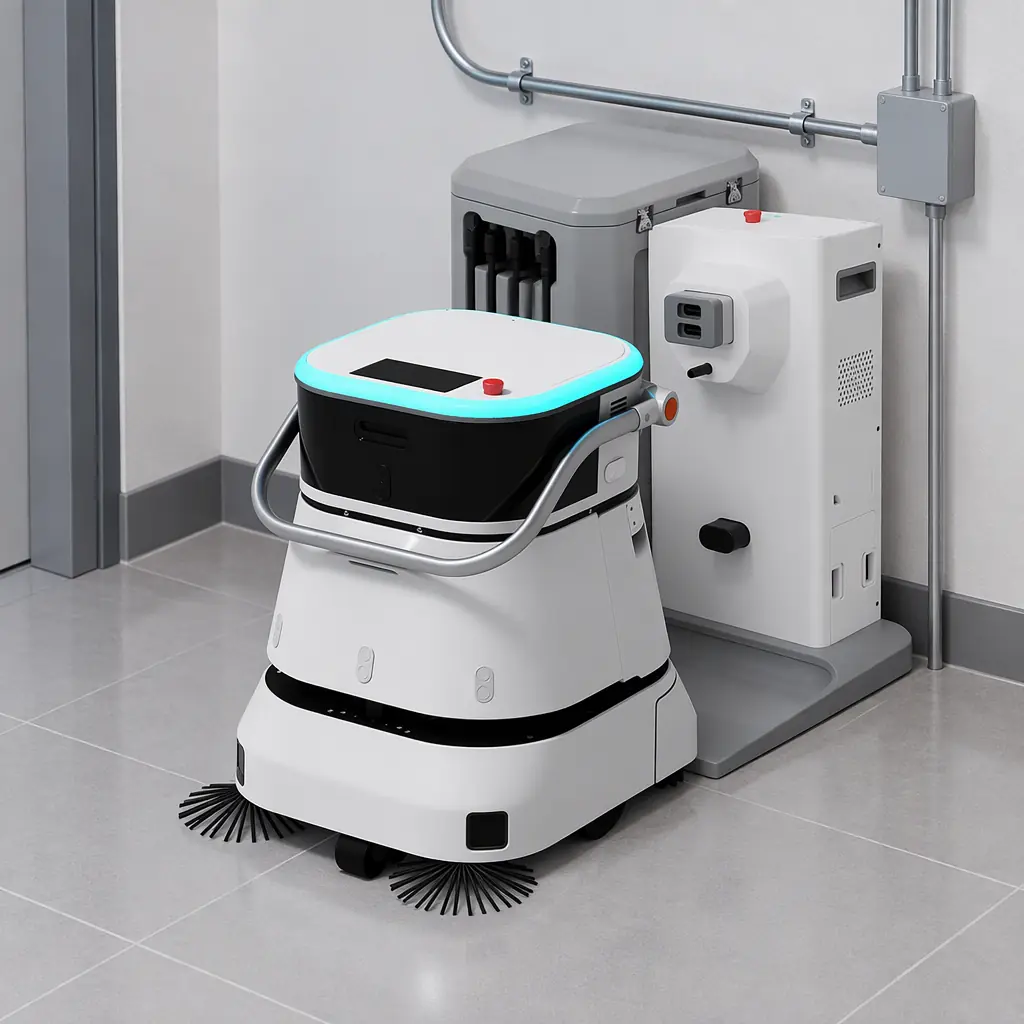
Fleet dashboards are good at telling you what happened. Battery levels, coverage per shift, error logs, mission completions, distance travelled — the data is plentiful and the visualisations are pleasant. The problem is that all of it describes the past. A dashboard that tells you a brush motor drew more current yesterday has not given you a maintenance decision; it has given you a chart. The transition from monitoring to prediction is a specific and much narrower exercise: finding the channels whose movement precedes a failure by a useful interval, establishing a threshold that fires early enough to act on, and confirming the intervention costs less than the failure it prevents.
This guide does that exercise for cleaning robot fleets specifically, because the failure modes on a floor scrubber are different from those on a manipulator or a vehicle, and the channels that matter follow from those modes.
The Failure Modes You Are Actually Predicting
Predictive maintenance only works against failure modes that have a measurable degradation path. A controller board that fails instantly from a solder defect has no precursor and no telemetry will anticipate it. Everything else on a cleaning robot — the ones driven by wear, contamination, alignment drift or thermal stress — does have a path, and there are six that account for most unplanned stops on commercial fleets.
| Failure Mode | Degradation Path | Time From First Signal to Failure | Predictable? |
|---|---|---|---|
| Brush motor brush wear | Commutation degrades, current draw rises for the same load, then thermal trip | 80–200 operating hours | Yes — current and temperature trend |
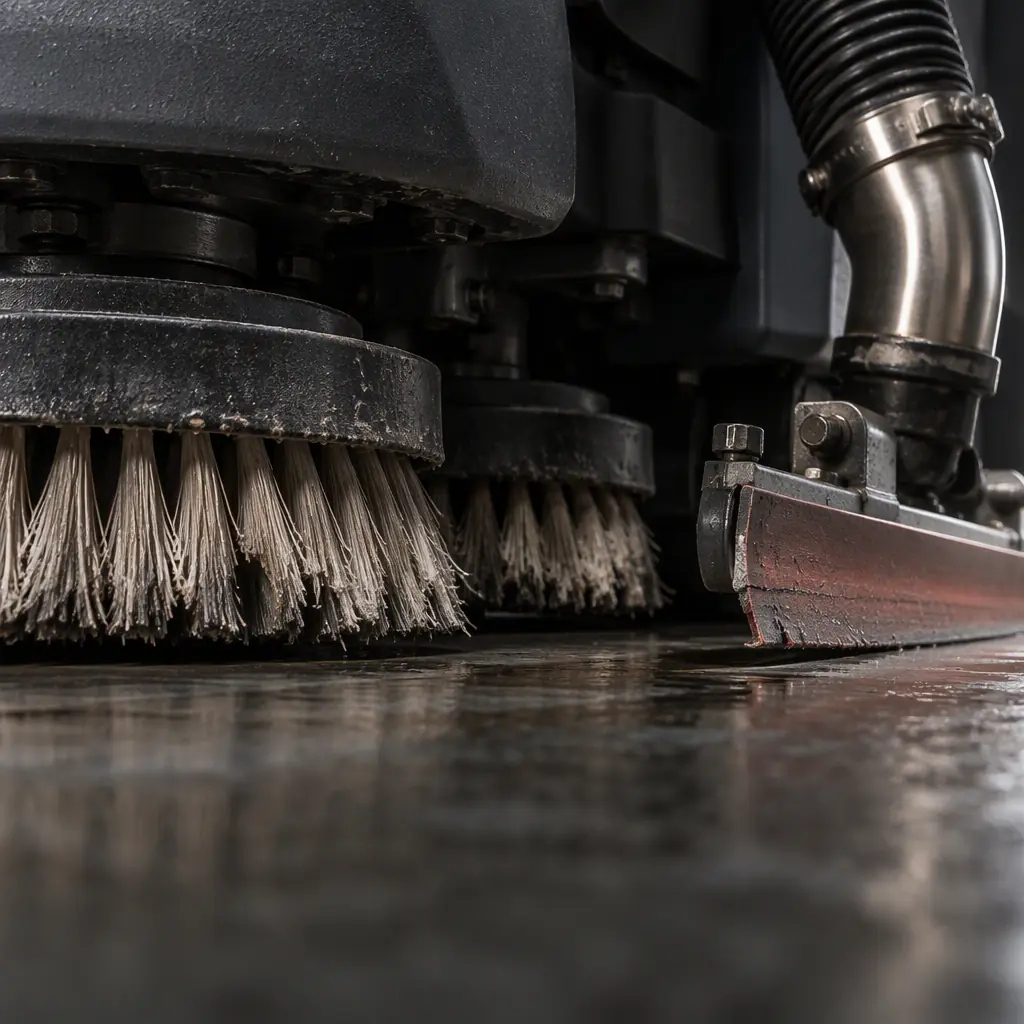
| Squeegee blade wear and deformation | Recovery efficiency drops, wet streak appears, vacuum load falls | 60–150 hours | Yes — recovery-to-applied water ratio |
| Filter and recovery tank blockage | Vacuum motor works harder, airflow falls, suction drops before trip | 20–60 hours | Yes — vacuum motor current at constant speed |
| Battery capacity fade | Usable capacity declines per cycle; charge time to 80% shortens | Months — an order of magnitude ahead | Yes — capacity-per-cycle trend is the cleanest signal on the platform |
| Wheel and drive assembly wear | Position error grows, drive current rises for the same path, odometry drifts | 100–300 hours | Yes — but requires a consistent reference route |
| Sensor contamination | Lidar return intensity drops, localisation confidence falls, map mismatches increase | 10–40 hours | Partially — confidence is confounded by site changes |
The time-to-failure column is the one that determines whether prediction is worth anything. A signal that surfaces six months ahead of a battery failure lets you plan capital. A signal that surfaces twenty hours ahead of a filter blockage is genuinely useful for scheduling, because it converts a mid-shift breakdown into a planned intervention at shift end. A signal that surfaces ten minutes ahead of anything is just an alarm, and an alarm is not predictive maintenance.
The Signals With Real Predictive Value
Of the channels a fleet reports, roughly a dozen carry predictive information. The rest are lagging indicators — they describe a state that has already been reached, which is useful for reporting and useless for prevention. The distinction is not about which channel it is, but whether the channel moves before the failure or because of it.
| Signal | Type | Threshold to Watch | Leading Typical Failure By |
|---|---|---|---|
| Brush motor current at fixed load | Leading | +15–20% above commissioning baseline | 60–120 h |
| Brush motor temperature rise over ambient | Leading | +12 °C over commissioning delta | 20–50 h |
| Vacuum motor current at constant speed | Leading | +20% sustained across three shifts | 20–40 h |
| Water applied to water recovered ratio | Leading | Fall of more than 8 points from baseline | 30–80 h |
| Usable capacity per full charge | Leading | Decline of more than 12% from first-year median | 3–9 months |
| Charge time to 80% state of charge | Leading | Shortening by more than 25% | 1–6 months |
| Drive current per metre at constant speed | Leading | +18% on a repeatable route | 80–200 h |
| Localisation confidence variance | Leading, noisy | Sustained 2σ drop on unchanged routes | 5–30 h |
| Distance and hours since last service | Context | Not a threshold — a multiplier on every other signal | n/a |
| Mission completion rate | Lagging | Any fall is already a symptom | Already failed |
| Error log frequency | Lagging | Counts past events; useful for triage, not prediction | Already failed |
| Coverage per shift | Lagging | Affected by schedule and site, not just machine condition | Already failed |
The bottom three rows are where most fleet analytics effort is wasted. Mission completion rate, error frequency and coverage are the metrics that appear on dashboards because they are easy to compute and satisfying to look at, and none of them predict anything. By the time completion rate falls, the failure has occurred. A predictive programme built on them is an alarm system with a history function.
Turning a Threshold Into a Decision
A threshold is not a decision. The gap between "brush motor current is up 18 percent" and "replace the brush assembly this week" requires two more quantities: the expected remaining operating hours before failure, and the cost comparison between intervening now and failing in service. The first comes from the degradation rate on your own fleet — how many operating hours the signal took to move from baseline to threshold — projected forward to the failure point. The second is the arithmetic that most programmes skip.
| Scenario | Direct Cost | Consequential Cost | Total |
|---|---|---|---|
| Planned intervention (replace brush assembly at threshold) | Item €180 + 1.5 h labour €135 | Scheduled at shift end; zero coverage lost | €315 |
| Run to failure (motor thermal trip mid-shift) | Item €180 + emergency callout €260 + 3 h labour €270 | Shift coverage lost on 3,000 m² at €0.42/m² = €1,260, plus a substitute manual pass | €1,970+ |
| False positive (replace at threshold, item had 40 h left) | Item €180 + 1.5 h labour €135 | None — the part was consumed early, not discarded | €315, of which €60–90 is premature |
The table contains the argument for predictive maintenance on cleaning fleets, and it is not the parts cost. The exposed cost is the consequential one: a machine that trips mid-shift on a committed cleaning programme creates a coverage gap with a contractual consequence, and that gap is typically four to six times the value of the planned intervention. The same arithmetic also shows why false positives are tolerable. A spurious intervention costs the labour and the remaining life of a cheap consumable. A missed prediction costs a disrupted shift. The asymmetry means a fleet programme should tolerate a relatively high false-positive rate and should not be tuned to minimise false alarms at the expense of missed ones — the opposite of the instinct that tends to drive alarm tuning. The downtime-cost framework behind those numbers is developed in downtime cost and OEE.
Getting the Baselines Right
None of the thresholds above are absolute, and treating them as absolute is the second most common way these programmes fail. Every threshold is a deviation from a per-unit, per-site baseline, and the baseline has to be captured correctly at commissioning or it will never be trustworthy.
Four requirements make a baseline usable. First, it must be captured under defined conditions: a specific floor type, a specific pass pattern, a specific soil load category. Brush motor current on a smooth sealed concrete floor and on a rough unsealed surface differ by more than the degradation you are trying to detect, so a baseline that averages across floor types has no predictive power. Second, it must be captured in the first days after commissioning, before wear begins but after any run-in period. Third, it must be per unit rather than per fleet model, because manufacturing variation between two machines of the same type can exceed the degradation signal over the early months — a fleet-wide threshold will produce persistent false positives on the machine at the high end of the distribution. Fourth, it must be re-captured after any change with a mechanical consequence: brush replacement, squeegee change, motor replacement, wheel assembly work. The hours immediately after a component change belong to the new component, and carrying forward the old baseline will show a step change that is real but not a fault.
The practical consequence is that the first month of fleet operation should be treated as a baseline campaign rather than a performance period. Fleets that skip it spend the following year arguing with false alarms generated by comparing machines to each other instead of to themselves. The measurement conventions that make those comparisons defensible, including how to normalise for area and pass count, are set out in service robot KPI benchmarks.
What Telemetry Cannot Predict — and Why That Matters
Being explicit about the limits prevents a fleet programme from over-promising internally and then being judged against the promise. Four categories of failure are effectively invisible to onboard telemetry.
The first is any sudden electronic failure: a controller, sensor board or power stage that fails without a precursor. No degradation path, no prediction, and the only mitigation is spares and a response SLA. The second is site-caused damage: impact, cable ingestion, water ingress at a dock, a door closing on a machine. These are discrete events, not trends, and the useful data is post-hoc for triage rather than predictive. The third is failures originating in work the operator does not report — a machine that is handled roughly during manual intervention degrades faster than its signals suggest, and since nothing in the fleet reports how it was manhandled, the model is blind to the cause and will over-attribute the degradation to component life. The fourth is anything caused by a firmware or configuration change, where the machine is not degrading at all but behaving differently by design.
The honest framing for a fleet programme is that predictive maintenance covers the wear-driven majority of unplanned stops and does nothing for the sudden minority. That split is still a favourable trade, because the wear-driven failures are the ones that occur mid-shift and carry consequential cost, while sudden electronic failures are frequently covered under a parts contract. This is where predictive maintenance and contract coverage are complements rather than substitutes, which is the analysis in service contract versus warranty economics.
What AOMAN's Platform Reports
AOMAN FUTURE's cleaning platforms — the C1 large-format scrubber and the C2 Pro compact cleaner — expose the leading signals rather than only the completion statistics. Per-unit telemetry includes brush and vacuum motor current and temperature, water applied and recovered volumes, drive current, charge capacity per cycle, charge time to state of charge, and localisation confidence, logged per mission with the route and floor zone attached.
The design decision worth noting is that baselines are captured per unit per zone at commissioning rather than assigned from a fleet-wide model, which is the requirement that makes the thresholds usable without a false-alarm campaign. Motor current and water recovery are logged continuously rather than sampled at mission end, so a trend is visible within a shift instead of a week. What AOMAN does not provide is an automated prediction service that will tell you when to replace a component; the platform supplies the signals and the per-unit baselines, and the interpretation — including the failure-versus-intervention cost comparison above — remains yours or your service partner's. That boundary is deliberate, because the intervention economics depend on your labour rates and your coverage obligations, not on the machine. If you want the baseline captured during a trial on your own floors, request a telemetry baseline assessment and we will report the leading signals for your site class alongside the machine's consumption figures. For the wider operating-cost context, see the failure modes and business continuity guide and the battery and charging technology overview.