
Service Robots for Industrial Parks & Multi-Building Complexes, A Cost Model for Eight-Building Sites
At a glance: An industrial park is a set of buildings with one security gate and one budget, which is why almost nobody knows the true blended cleaning cost per square metre. This model splits the site into three loops, works an eight-building 96,000 m² example, and exposes the two cost lines that get left out of most robot business cases.
An industrial complex is not a building. It is a set of buildings with different maintenance contracts, different shift patterns and different access restrictions, sharing one security gate and one budget. Cleaning budgets at these sites are typically assembled contract by contract, which is why almost no operator knows the true blended cost per square metre. When that number is finally calculated, it usually lands between $0.34 and $0.39 per m² per year for an eight-building industrial park at European labour rates, and roughly two thirds of it is labour.
Modelling an autonomous cleaning fleet properly requires splitting the site into three loops, because the machine that wins on the warehouse floor loses badly in a two-storey office block. The model below uses an eight-building, 96,000 m² industrial complex as the worked example.
Split the Site Into Three Loops Before Talking to Any Vendor
The single most common modelling error is averaging the whole site. Industrial parks contain large-format floors, mixed commercial floors and residential-scale floors, and they need different machines on different duty cycles.
| Loop | Typical Share of Area | Surface Character | Machine Class | Why |
|---|---|---|---|---|
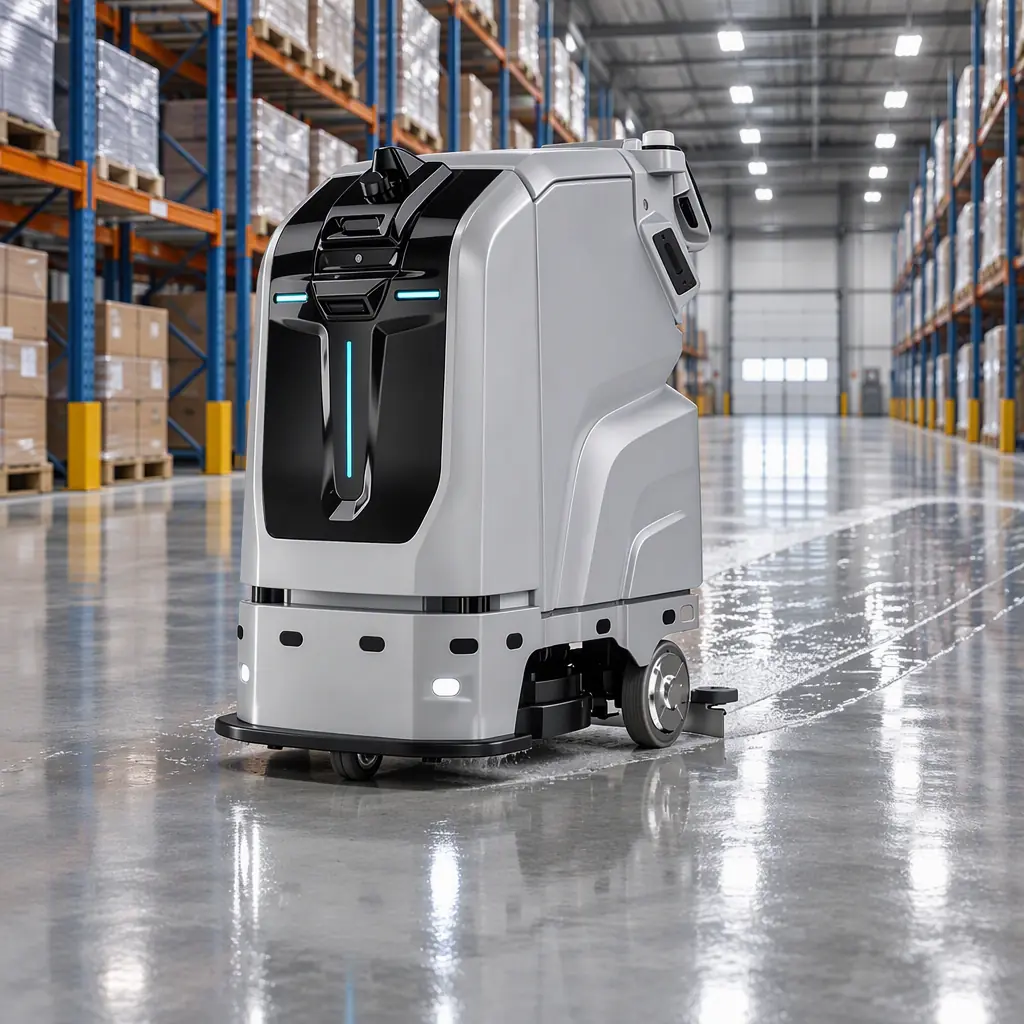
| A, Production and warehouse floors | 55-65% | Large open industrial concrete or epoxy, forklift traffic, swarf and packaging debris, night-shift accessible | AOMAN C1 | Up to 2,040 m²/h with a 790 mm squeegee and 160 RPM disc brushes at 13.2 g/cm² working pressure clears bonded industrial film that a compact unit only smears; 6° ramp capability and 5 cm toe-height obstacle sensing handle loading-dock transitions and expansion joints |
| B, Office, canteen and common areas | 20-25% | Terrazzo, vinyl, carpet edges, corridors and meeting rooms, occupied in daytime | AOMAN C2 Pro | 440 mm cleaning width and 700 mm narrow-aisle clearance fit standard corridor and cubicle layouts; dust-mopping, vacuuming and scrubbing in one pass means one machine covers a mixed-floor office without swapping attachments |
| C, Perimeter, yards, loading bays and car parks | 15-20% | Open-air asphalt and concrete, grit, tyre debris, standing water, weather-exposed | AOMAN C1 (daylight window) | Same large-format unit as Loop A, working the outdoor surfaces in the low-traffic hours; recovery tank capacity, not runtime, sets how far it works between drains |
Loops A and C sharing a machine is the single biggest capital saving on an industrial site, and it only works if the outdoor surfaces are physically reachable from the indoor dock. That is an infrastructure question, not a robot question. And it should be answered before the fleet is specified, not after.
What the Eight-Building Model Actually Costs
The model uses published AOMAN machine parameters, a three-shift industrial park in a mid-cost labour market, and an assumption that the site currently runs a day-shift cleaning crew plus a weekly contract scrub of production floors. Labour is costed at $19.50 per hour fully loaded, wage plus employer contributions, supervision, training and consumables attributable to the cleaner.
| Cost Line | Manual Baseline (annual) | Two-Unit Autonomous Fleet (annual) | Change |
|---|---|---|---|
| Direct cleaning labour | $486,720 6.0 FTE across loops at $19.50/h | $243,360 3.0 FTE redeployed to supervision, restrooms and detail work | −$243,360 |
| Machine service and consumables | $31,400 Rotary scrubbers, pads, chemicals | $58,900 2 units: brushes, squeegee strips, pads, filters, annual service | +$27,500 |
| Electricity for charging | Included in manual equipment | $4,180 6.6 kW average draw, 2 units, 4 h/day charge | +$4,180 |
| Software and fleet management | $0 | $8,640 2 licences at $360/month | +$8,640 |
| Site supervision (added) | $0 | $16,000 0.4 FTE for fleet oversight and exception handling | +$16,000 |
| Annual total | $518,120 | $331,080 | −$187,040 |
| Blended cost per m² | $0.540 | $0.345 | −36% |
The headline is a 36% reduction in blended cost per square metre, but the interesting numbers are in the middle rows. Machine service and consumables rise 88% because an autonomous fleet consumes brushes and squeegee strips on machine hours rather than on a human's judgement about when a pad is finished. Sites that model the labour saving and not the consumable increase routinely report a first-year saving 20-25% below projection.
Supervision is the second line that gets omitted. Nobody supervises a cleaning contractor's evening crew in real time; somebody does have to look at a robot dashboard, clear exceptions and handle the morning after a machine maps its way into a storage bay. Budget 0.2 FTE per unit as a planning figure. The wider staffing implications of that shift are worked through in the change management playbook.
Three Mistakes That Break the Model
Assuming the machines replace whole FTE. A two-unit fleet at an industrial park does not remove six cleaners from a roster. It removes the large-format floor scrubbing from their task list, which lets the same headcount cover the restrooms, canteen and detail work that was previously deferred. The saving shows up as avoided headcount growth during the next contract renewal, not as six redundancies on day one. Sites that plan for immediate headcount removal usually fail the first audit of the deployment.
Averaging machine rates across all surfaces. The rated 2,040 m²/h for the C1 is a production-floor figure on a clean run. Warehouse floors with racking legs, pallet debris and forklift traffic typically run at 55-70% of rated rate because of obstacle handling and re-passes. Two-thirds of rated is the honest planning number, and it is the figure that decides whether you need two machines or three. The arithmetic is the same as the downtime modelling in the OEE guide.
Ignoring shift windows. Industrial parks have the most generous cleaning windows of any commercial site. Production floors are empty between shifts and often overnight. A site that runs a single day shift has almost no automation constraint. A site running three shifts has to schedule around them, which cuts effective machine hours by roughly a third and, again, moves the fleet size.
Where the Payback Sits
At the two-unit specification used above, the capital outlay lands in the $54,000-72,000 range depending on configuration and the outdoor-duty package. Against a net annual saving of $187,040 the arithmetic payback falls inside six months. Which is fast enough that the deployment should be phased rather than bought all at once.
A published three-stage phasing exists: one unit on Loop A or Loop B for a 90-day pilot with measured coverage data, a second unit added against the loop that produced the weaker result, and the outdoor Loop C added in season two once the dock siting is proven. That sequence costs more in total than a single order, but it produces two decision points where the fleet size can be corrected while the correction is still cheap. The full roadmap is set out in the 30-60-90 pilot guide, and the financing side is covered in the buy-versus-lease guide.
A complementary check is the budget-planning calculator, which sizes a fleet from facility area and shift pattern rather than from headcount. Useful when a park is expanding and the cleaning contract has not yet been renegotiated. See the 2026 budget planning guide.
The Infrastructure Question Nobody Budgets For
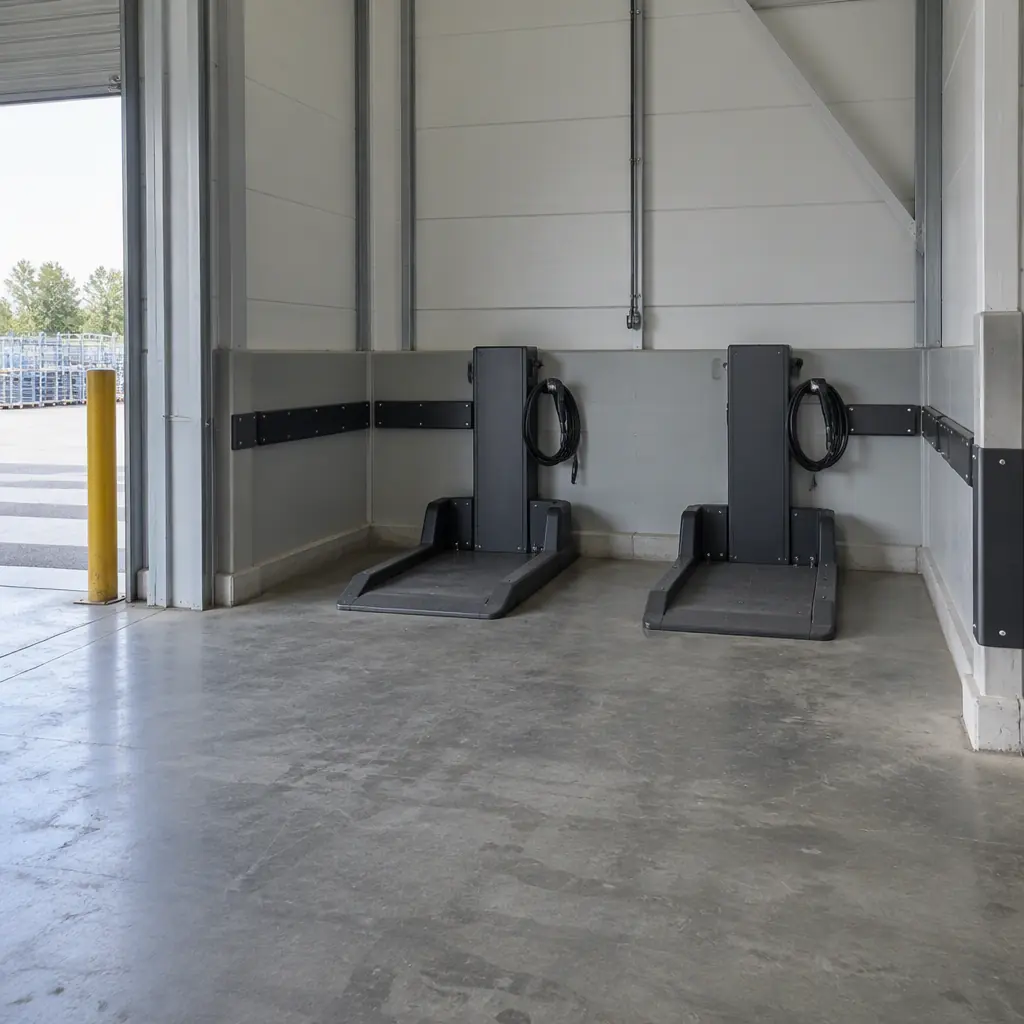
Two charging docks at an industrial park are not a plug socket each. The C1 draws 24 V / 120 Ah with an approximately 8-hour charge; two units on a daytime charge cycle represent a sustained load that has to come off an existing distribution board, and industrial parks frequently have their docks at the opposite end of the site from the nearest spare capacity.
Practical mitigations, in order of cost: site the docks in the existing maintenance workshop where a three-phase board is already present; stagger charge windows so only one unit charges at peak tariff; or accept a longer charge cycle and size the fleet with a 20% runtime margin instead of adding electrical work. Sizing the electrical side before the fleet is ordered avoids the scenario where the machines arrive and the docks are three months behind. See the charging infrastructure planning guide for the per-unit load arithmetic.
What to Measure in the First Two Quarters
Three metrics decide whether the model holds: machine hours per loop per week against the planned window; consumable cost per 1,000 m² cleaned, tracked monthly from day one; and the number of manual interventions per 100 machine hours. The third one is the early-warning signal. A rising intervention rate almost always precedes a coverage shortfall, and it is usually a mapping or dock-siting problem rather than a robot fault. The failure taxonomy is set out in the failure modes and continuity guide.
Tell us your site layout, building count and shift pattern, and we will build the three-loop cost model against your actual surfaces before you commit to a fleet size. Contact us.